A commercial energy storage system pays for itself with a small number of measurable revenue streams: demand-charge reduction, time-of-use (TOU) arbitrage, PV self-consumption, backup value and grid services. In 2026, most C&I systems in markets with real tariff spreads pay back in 3 to 7 years, and the difference between a 3-year and a 7-year project is almost entirely decided by the inputs you put into the calculation. This guide walks through every input and shows you how to run the numbers before you buy.
The five revenue streams
Five streams can return value from a C&I battery, and a good business case usually stacks several. Demand-charge reduction: the battery clips your peak power draw, lowering the monthly demand charge billed on your highest 15- or 30-minute draw. TOU arbitrage: charge at the low valley rate, discharge at the high peak rate, and pocket the spread. PV self-consumption: store surplus solar in the middle of the day and use it in the evening instead of buying grid power. Backup value: keep critical loads running during outages — an avoided-downtime value that can be large for manufacturing or data-heavy businesses. Grid services: frequency regulation or demand response programs in markets that pay for them. The first four are available almost everywhere; grid services depend on your market.
The inputs you need before calculating
To run the payback, gather these numbers first. Tariff: the demand charge per kW, the TOU energy rates per kWh and the peak-valley spread, and the demand-interval used by your utility (15 or 30 minutes). Load profile: your hourly demand over a year, especially the peak hours and how spiky the peaks are. System specs: usable capacity in kWh, rated power in kW, round-trip efficiency, cycle life at the DOD you plan, and the price you actually pay for the system installed. O&M: expected annual operating and maintenance cost. Degradation: how capacity fades over the warranty period. Financing: the cost of capital or the lease terms. Most of these are on your utility bill and the supplier datasheet; the two you must estimate carefully are your real load profile and your real tariffs.
How to calculate the annual saving
The annual saving is the sum of each active stream, and each stream has a simple formula. Demand-charge saving = clipped kW x demand charge per kW x 12 months. TOU arbitrage = kWh shifted per day x peak-valley spread x days per year x round-trip efficiency. PV self-consumption saving = kWh of solar shifted to evening x the retail rate you avoid. Backup value = estimated avoided-downtime cost per outage x expected outage frequency. Add the streams that apply to your site, subtract the annual O&M, and you have the net annual saving. The payback period is then: installed system cost / net annual saving. That single division is the whole business case in one line.
A worked example
Take a factory with a 1,200 kW peak, a demand charge of $12/kW, and a TOU spread of $0.09/kWh between a 4-hour valley window and a 4-hour peak window. A 400 kW / 860 kWh system installed for $160,000. Demand reduction: shave 300 kW of peak, 300 x $12 x 12 = $43,200 per year. TOU arbitrage: shift 700 kWh per day at $0.09 with 90% efficiency, 700 x 0.09 x 0.9 x 330 days = $18,711 per year. Net annual saving after $4,000 O&M: about $57,900. Payback: $160,000 / $57,900 ≈ 2.8 years. Over a 10-year life with modest degradation, the system returns roughly three times its cost. Change the inputs — a smaller tariff spread, a less spiky load — and the payback stretches to 5-6 years. That is why the tariff and load inputs matter more than the hardware price.
Why efficiency and cycle life quietly dominate the math
Two specs sit inside the calculation and change the answer more than the battery price. Round-trip efficiency determines how much of the energy you buy actually comes back out — a 90% efficient system loses 10% of every cycle to heat. Cycle life at your DOD decides how long the asset earns: a battery rated for 6,000 cycles at 80% DOD out-earns one rated for 4,000 cycles by a third, even at the same price. When comparing quotes, ask for the efficiency curve and the cycle life at the DOD you plan, not the headline capacity. Two systems with identical kWh can have very different 10-year economics purely on these two numbers.
Degradation and the realistic 10-year curve
Batteries do not deliver their rated capacity every year. A typical LFP system fades to roughly 80-90% of initial capacity over 8-10 years, and the payback calculation should reflect that declining output rather than assuming flat performance. A simple way: take the first-year saving, and multiply it by 0.85 to 0.9 for the average saving over the warranty period, or build an annual degradation curve into a spreadsheet. The same battery that pays back in 2.8 years at full output pays back in about 3.2 years using a realistic degradation profile — the difference matters for the investment decision but rarely changes the conclusion that the asset is profitable.
Incentives, tax credits and soft revenue
Before finalizing the payback, check what your market subsidizes. Investment tax credits, storage rebates, demand-response payments and time-of-use retail tariffs all change the equation. In markets with a strong investment tax credit, the effective installed cost drops by the credit percentage, shortening payback proportionally. Some utilities also allow storage to participate in demand response or peak-time rebates that pay per kilowatt of load you shed. These vary by country, state and even utility, so a five-minute check with your utility or a local consultant can change the payback by a year or more. Do the incentive check before, not after, you size the system.
Whole-life cost: O&M and replacement
The business case should include the cost of running the asset. Annual O&M typically covers remote monitoring, filter or coolant checks, insurance and periodic testing — a modest but real line item. In some markets, capacity fading to the warranty floor triggers a replacement decision at year 8-10, and the calculation should acknowledge that the residual value or replacement cost sits at the end of the cash flow. A well-designed system with liquid cooling and a documented maintenance plan usually carries lower O&M than a marginal system with thin documentation, so the O&M estimate should come from the supplier's actual track record, not an optimistic default.
Wholesale buyers: model the asset, not the price
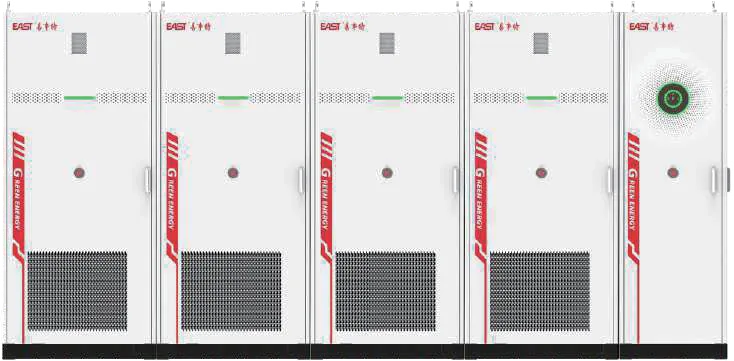
For distributors and channel buyers, the ROI model is a selling tool as much as a purchase decision. Stock the inputs that make the model credible — real tariffs, real load profiles, the efficiency curve and cycle life — and pre-build a calculator your sales team can run for a customer in minutes. The factory should provide the technical inputs (efficiency curve, cycle life at DOD, degradation, O&M estimate) in writing. As a manufacturer of all-in-one commercial storage systems, we provide these parameters on request and support project-level modeling — send us your tariff, load profile and target capacity, and we will confirm the configuration and the payback math before you buy.
When the ROI does not work, and what to do
If the payback comes out longer than you can accept, the problem is usually one of three things: the tariff spread is too thin, the load is not spiky enough to clip, or the system is oversized for the actual saving. Fix the inputs before abandoning the project: model a smaller system that only clips the tallest spike, run the system in a single dominant mode instead of trying to do everything, or check whether an incentive changes the economics. A smaller, tightly-sized system often pays back faster than a large general-purpose one. If the math still does not close, the honest conclusion is to wait — storage is not the right asset for every site, and forcing the numbers rarely ends well.